Cookbook
See this guide for examples of different uses of BamQuery.
BamQuery can search for peptide expression in the human (GRCh38, annotation versions v26_88 / v33_99 / v38_104) and mouse (GRCm38 and GRCm39, annotation versions M24, M30, respectively) genomes.
normal mode example
Input
Command line:
BamQuery.py ./normal_mode_example/Input normal_mode_example v38_104
Input folder path_to_input_folder containing the files : BAM_directories.tsv and peptides.tsv. Please download BAM_directories.tsv and peptides.tsv to access an example of the format of these files.
See:
BAM_directories.tsv
See:
peptides.tsv
Output
BamQuery creates an output directory in the same path as the input folder.
This directory contains 4 folders and the main results are organized as follows:
├── alignments
│   ├── missed_peptides.info
│   └── normal_mode_info_alignments.xlsx
├── logs
│   ├── BamQuery_Res_normal_mode.log
│   └── Information_BAM_directories.log
├── plots
│   ├── biotypes
│   │   ├── biotype_by_sample_group
│   │   │   ├── all_peptides
│   │   │   │   └── normal_mode_All_peptides.pdf
│   │   │   └── by_peptide_type
│   │   │       ├── normal_mode_0D5P_Melanoma_ctrl_All_samples.pdf
│   │   │       └── normal_mode_0D5P_Melanoma_DAC_All_samples.pdf
│   │   └── genome_and_ERE_annotation
│   │       ├── all_peptides
│   │       │   └── normal_mode_All_peptides.pdf
│   │       └── by_peptide_type
│   │           ├── normal_mode_0D5P_Melanoma_ctrl.pdf
│   │           └── normal_mode_0D5P_Melanoma_DAC.pdf
│   └── heat_maps
│       └── transcription_evidence_heatmap
│           ├── average_transcription_expression_heatmap
│           │   ├── normal_mode_rna_norm_all_tissues.pdf
│           │   ├── normal_mode_rna_norm_selected_tissues.pdf
│           │   └── norm_info.csv
│           └── total_transcription_expression_heatmap
└── res
    ├── biotype_classification
    │   ├── full_info_biotypes
    │   │   ├── 1_Genomic_and_ERE_Annotations_Full.csv
    │   │   ├── 2_Genomic_and_ERE_Annotations_Summary_Full.csv
    │   │   └── 3_Genomic_and_ERE_Anno_by_Region_Full.csv
    │   └── summary_info_biotypes
    │       ├── 1_General_Gen_and_ERE_Biotype_Consensus.csv
    │       ├── 2_Sample_Gen_and_ERE_Biotype_Consensus.csv
    │       └── 3_Group_Samples_Gen_and_ERE_Biotype_Consensus.csv
    └── normal_mode_count_norm_info.xlsx
alignments
├── alignments
   ├── missed_peptides.info
   └── normal_mode_info_alignments.xlsx
missed_peptides.info file
This file reports the peptides for which BamQuery has not been able to find locations to evaluate their expression.
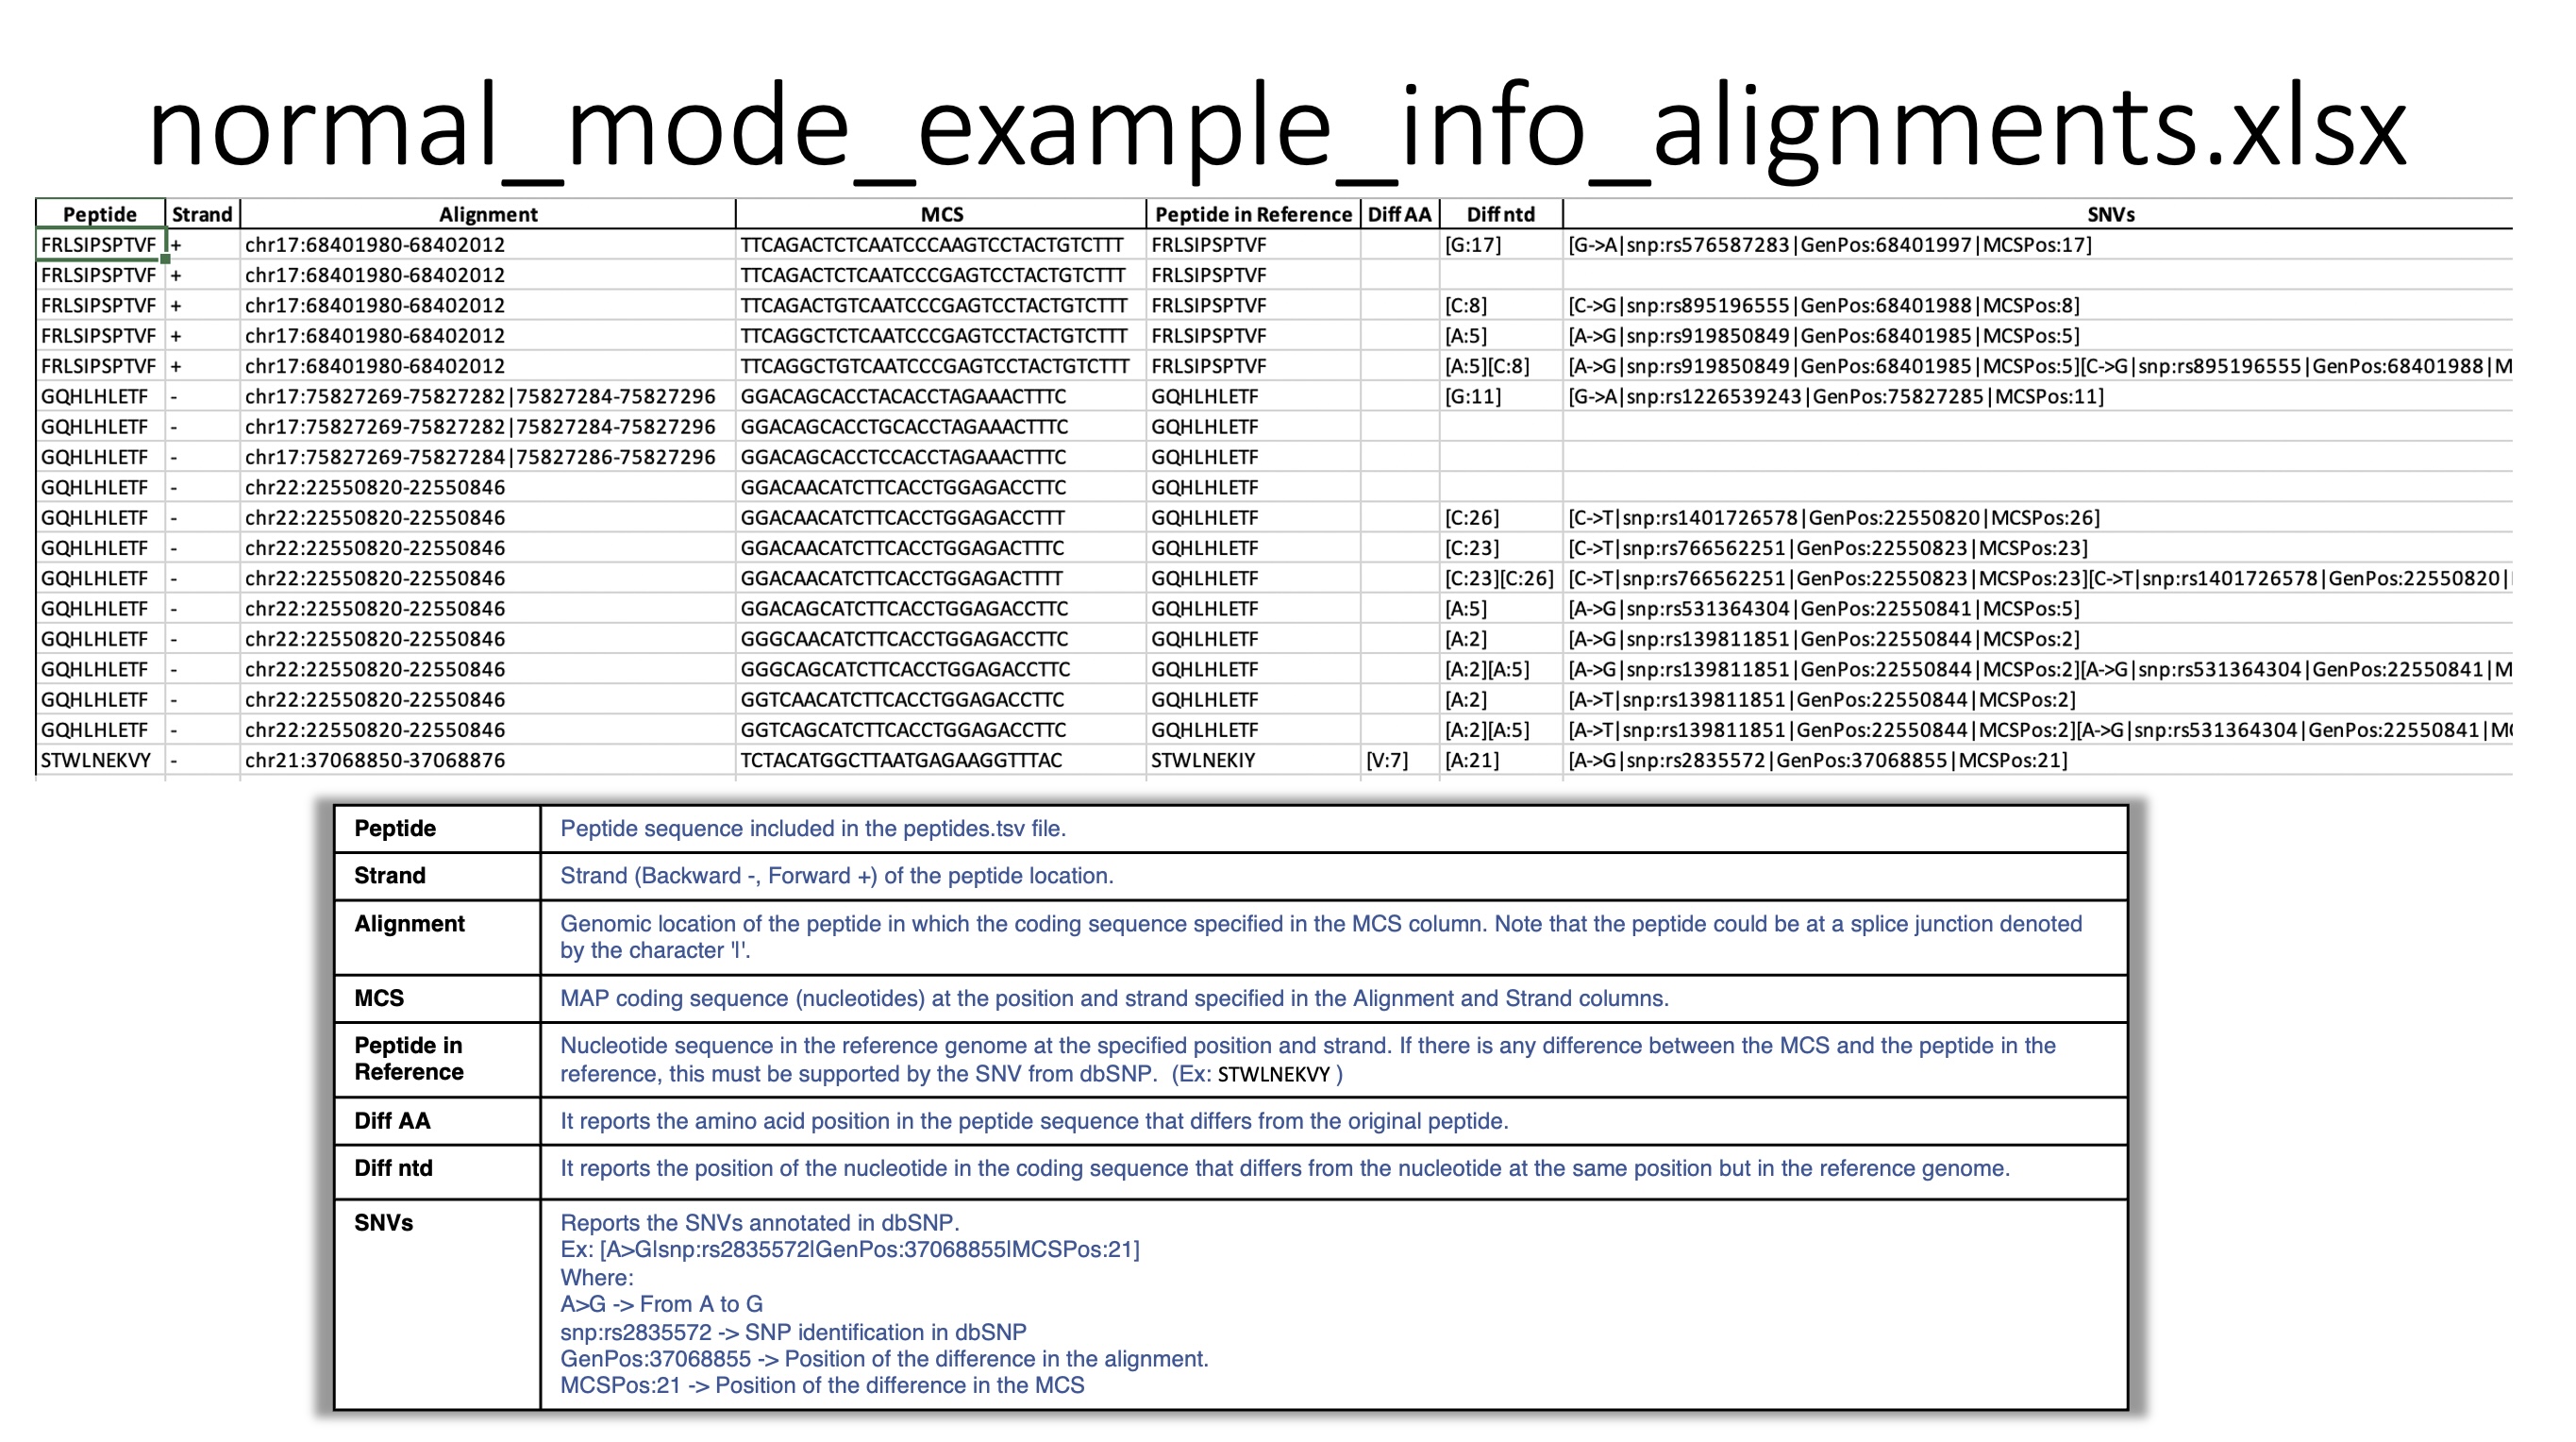
normal_mode_example_info_alignments.xlsx file
This file reports, for each peptide queried, all locations in the genome that are perfect alignments for one or more MAP coding sequences. In addition, it reports the somatic mutations annotated in the COSMIC database, encountered in the queried peptides.
Sheet : Perfect Alignments For each MAP: position, strand, MCS, reference amino acid, nucleotide differences and SNVs annotated in the dbSNP database are reported. In the case of the latter, it will be reported that the coding sequence has some difference with the reference genome, but has been compensated by one or more annotated SNVs.
Sheet : COSMIC Information Reports whether the SNVs displayed by the peptides have already been annotated as somatic mutations in the COSMIC database.

Find here the Additional information description from COSMIC.
logs
├── logs
│   ├── BamQuery_Res_normal_mode.log
│   └── Information_BAM_directories.log
BamQuery_Res_normal_mode_example.log file
This file reports all steps that have been performed in the BamQuery search. Refer to this file for the query time of all peptide alignments in the bams, the number of perfect peptide alignments, and the summary of the parameters used in the search.
Get_Read_Count_BAM_directories.log file
This file reports for each BAM/CRAM file in the BAM_directories.tsv the total number of primary read counts.
plots
The Plots folder contains the heat map and biotype analysis expression plots for all peptides. If the –plots parameter is specified, pie charts of the biotype classification are produced.
├── plots
│   ├── biotypes
│   │   ├── biotype_by_sample_group
│   │   │   ├── all_peptides
│   │   │   │   └── normal_mode_All_peptides.pdf
│   │   │   └── by_peptide_type
│   │   │       ├── normal_mode_0D5P_Melanoma_ctrl_All_samples.pdf
│   │   │       └── normal_mode_0D5P_Melanoma_DAC_All_samples.pdf
│   │   └── genome_and_ERE_annotation
│   │       ├── all_peptides
│   │       │   └── normal_mode_All_peptides.pdf
│   │       └── by_peptide_type
│   │           ├── normal_mode_0D5P_Melanoma_ctrl.pdf
│   │           └── normal_mode_0D5P_Melanoma_DAC.pdf
│   └── heat_maps
│       └── transcription_evidence_heatmap
│           ├── average_transcription_expression_heatmap
│           │   ├── normal_mode_rna_norm_all_tissues.pdf
│           │   ├── normal_mode_rna_norm_selected_tissues.pdf
│           │   └── norm_info.csv
│           └── total_transcription_expression_heatmap
biotypes
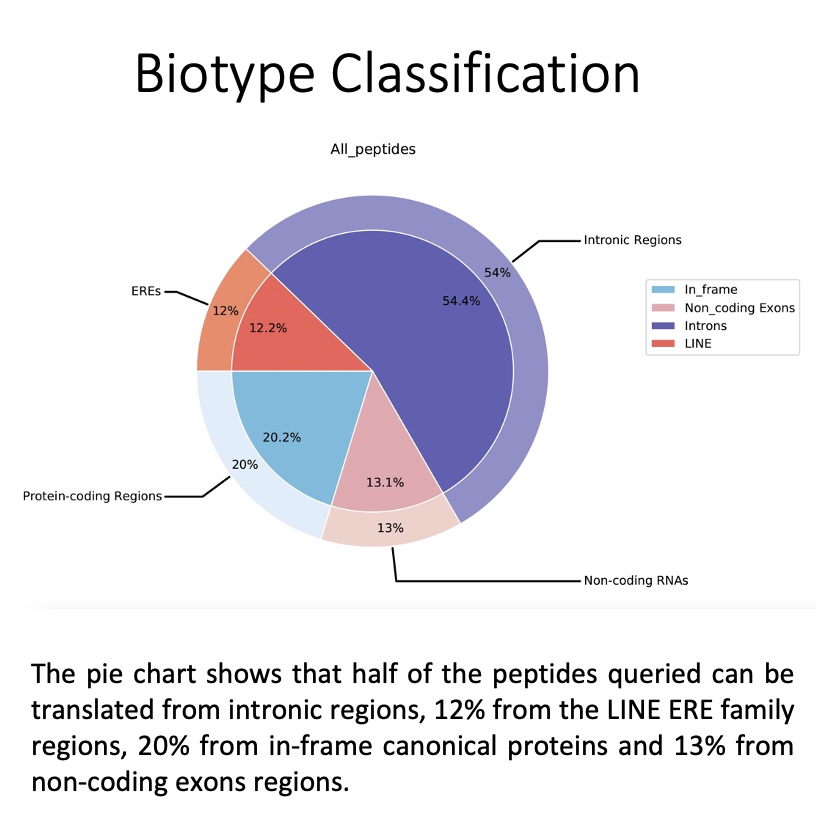
The biotype_by_sample_group folder contains the biotype assignment based on transcription expression, i.e. the biotype is computed based on those locations where there are underlying RNA-seq reads. For more information please refers to 5. Biotype classification. and Biotypes
This folder contains pie charts organised as follows:
all_peptides: Pie chart depicting the general assignment of biotypes for all peptides queried based on their transcription in the BAM/CRAM files consulted.
by_peptide_type: Pie charts showing the general assignment of biotypes according to each peptide type (specified in the peptides.tsv file) based on transcript expression, i.e. biotype is calculated based on the locations where there are underlying RNA-seq reads
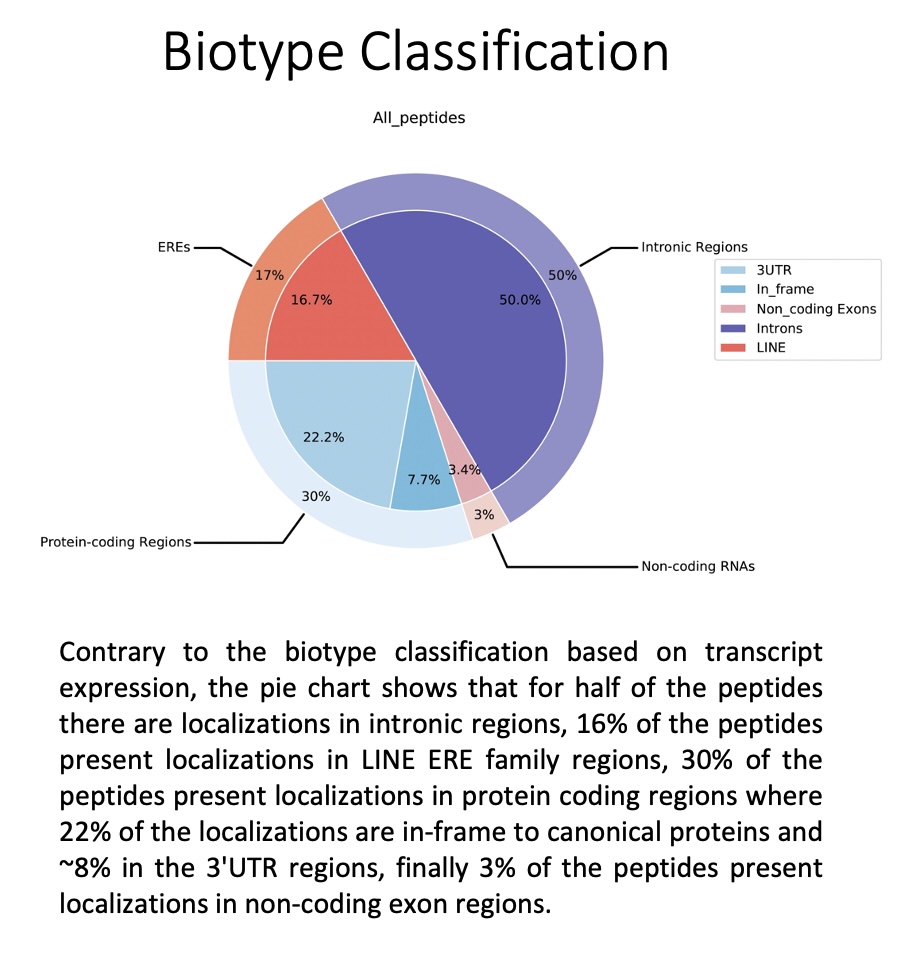
The genome_and_ERE_annotation folder contains the biotype assignment regardless of transcript expression, i.e. the biotype assignment for each peptide is calculated based on all locations in the genome (expressed or not).
This folder contains pie charts organised as follows:
all_peptides: Pie chart depicting the general assignment of biotypes for all peptides queried based on all the locations for all the peptides.
by_peptide_type: Pie charts showing the general assignment of biotypes according to each peptide type (specified in the peptides.tsv file) based on all the locations for all the peptides.
heat_maps
This folder contains the heat maps representing the transcription expression levels of all peptides queried.
average_transcription_expression_heatmap folder:
Heat maps representing the mean transcription expression for each peptide queried in the tissues associated with the BAM/CRAM files.
_norm_all_tissues.pdf: Heat map representing the average level of transcription expression associated with tissue types, computed from all samples in the tissue.
_norm_selected_tissues.pdf: Heat map representing the average level of transcription expression associated with tissue types, computed from selected tissues (short list of tissues).
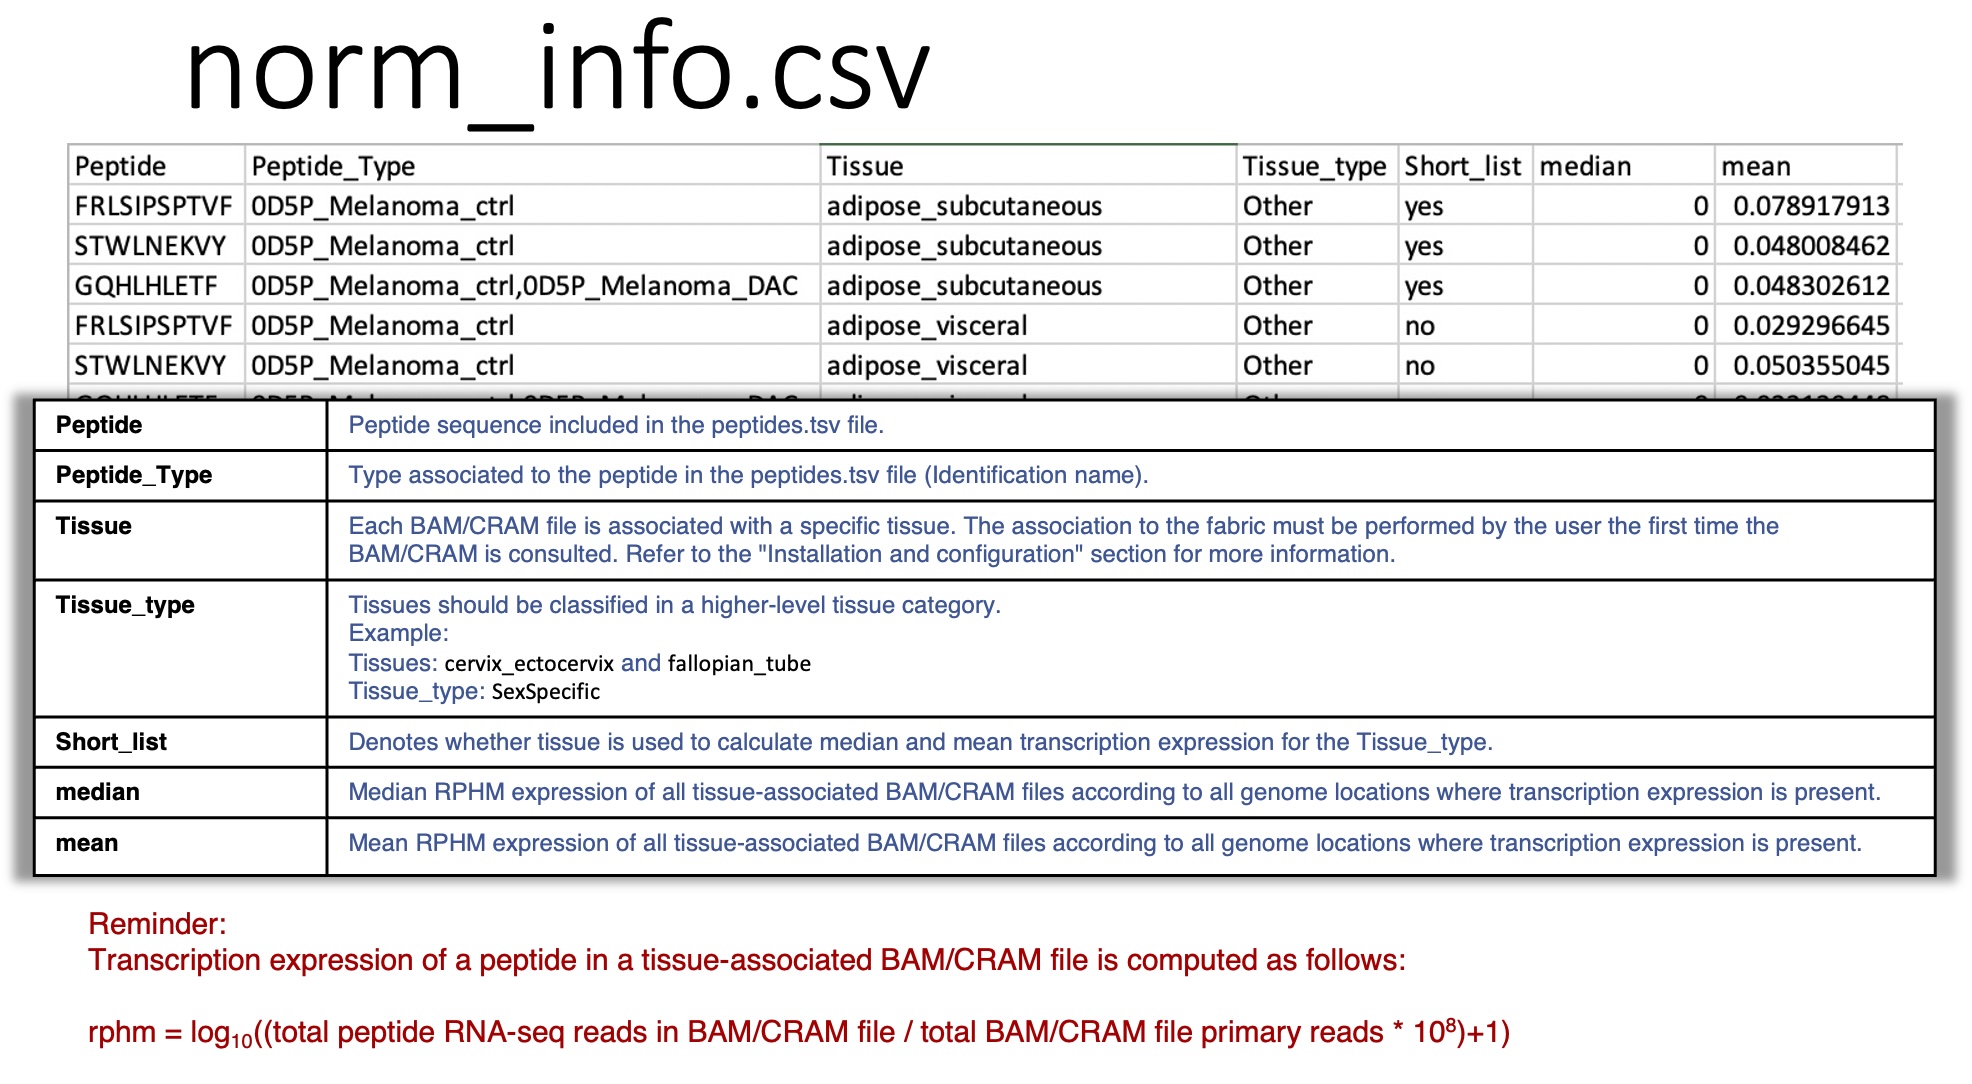
norm_info.csv: reports, for each peptide queried, the mean and median values of rphm in the tissues associated with the BAM/CRAM files.
total_transcription_expression_heatmap folder:
Heat maps representing the mean transcription expression and total number of RNA-seq reads for each peptide queried in each BAM/CRAM file.
Warning
Heat maps are produced for searches with less than 400 peptides.
Heat maps in total_transcription_expression_heatmap is produced only if the number of BAM/CRAM files queried are less than 100.
res
res
    ├── biotype_classification
    │   ├── full_info_biotypes
    │   │   ├── 1_Genomic_and_ERE_Annotations_Full.csv
    │   │   ├── 2_Genomic_and_ERE_Annotations_Summary_Full.csv
    │   │   └── 3_Genomic_and_ERE_Anno_by_Region_Full.csv
    │   └── summary_info_biotypes
    │       ├── 1_General_Gen_and_ERE_Biotype_Consensus.csv
    │       ├── 2_Sample_Gen_and_ERE_Biotype_Consensus.csv
    │       └── 3_Group_Samples_Gen_and_ERE_Biotype_Consensus.csv
    └── normal_mode_count_norm_info.xlsx
biotype_classification
Note
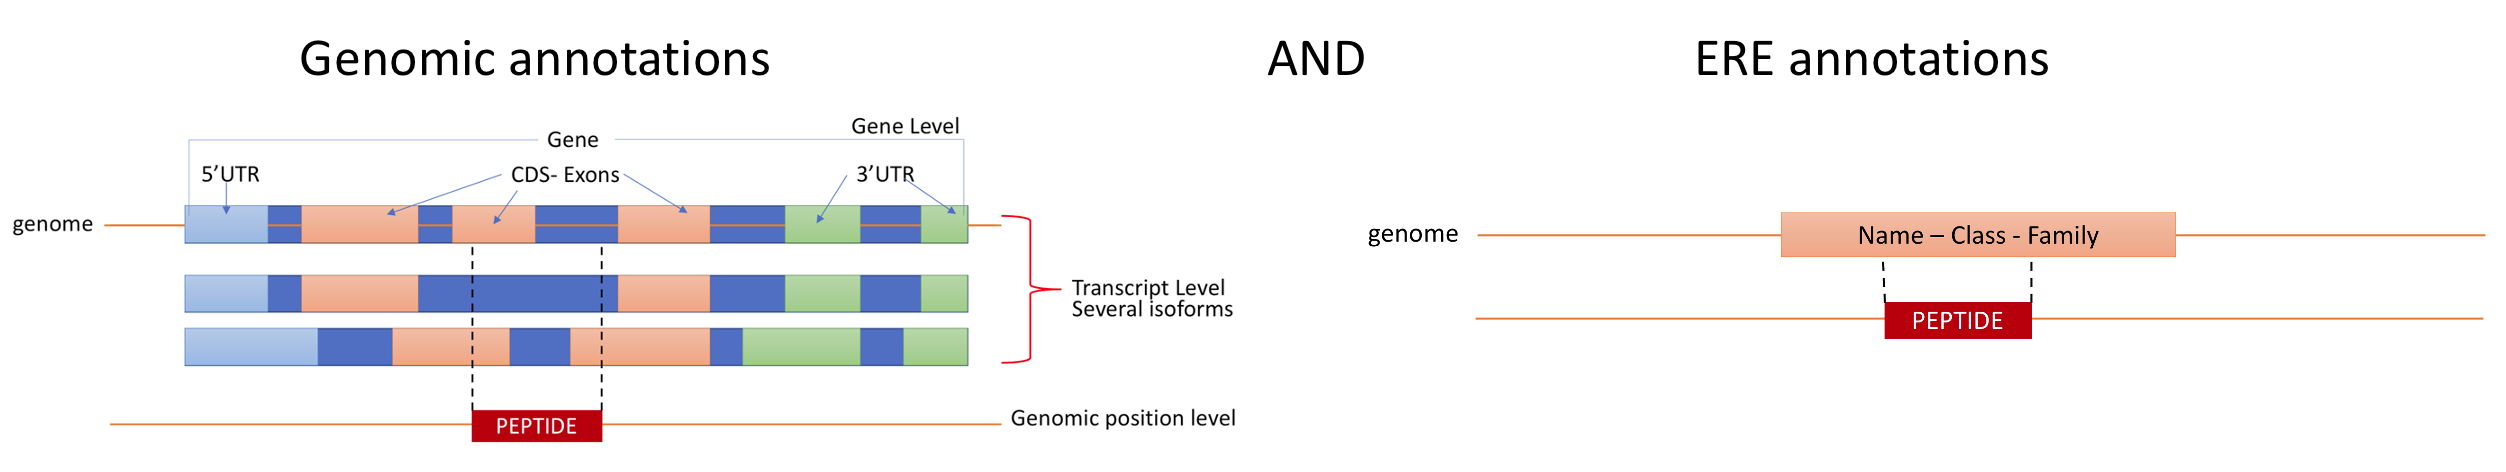
The biotype annotation is derived from the intersection of the peptide genomic locations with Ensembl and ERE annotations. For more information see Biotypes.
From Ensembl annotations, 3 levels of biotypes are reported : gene level, transcript level and genomic position level.
- At the genetic level, the biotype assigned to the genomic location is given by the biotype of the gene in Ensembl that overlaps with the location, for instance:
protein_coding,
lincRNA,
intergenic…
- At the transcript level, the biotype assigned to the genomic location is given by the biotype of the transcript in Ensembl that overlaps with the location, for instance:
protein_coding,
processed_transcript, TEC, etc…
- At the genomic position level, the biotype assigned to the genomic location is given by the exact location where the peptide is located in the transcript in Ensembl, for example:
In_frame,
junctions,
introns,
3’UTR, etc…
As for the ERE annotations, 3 levels of biotypes are reported: name, class and family of the ERE overlapping at the genomic location.
full_info_biotypes
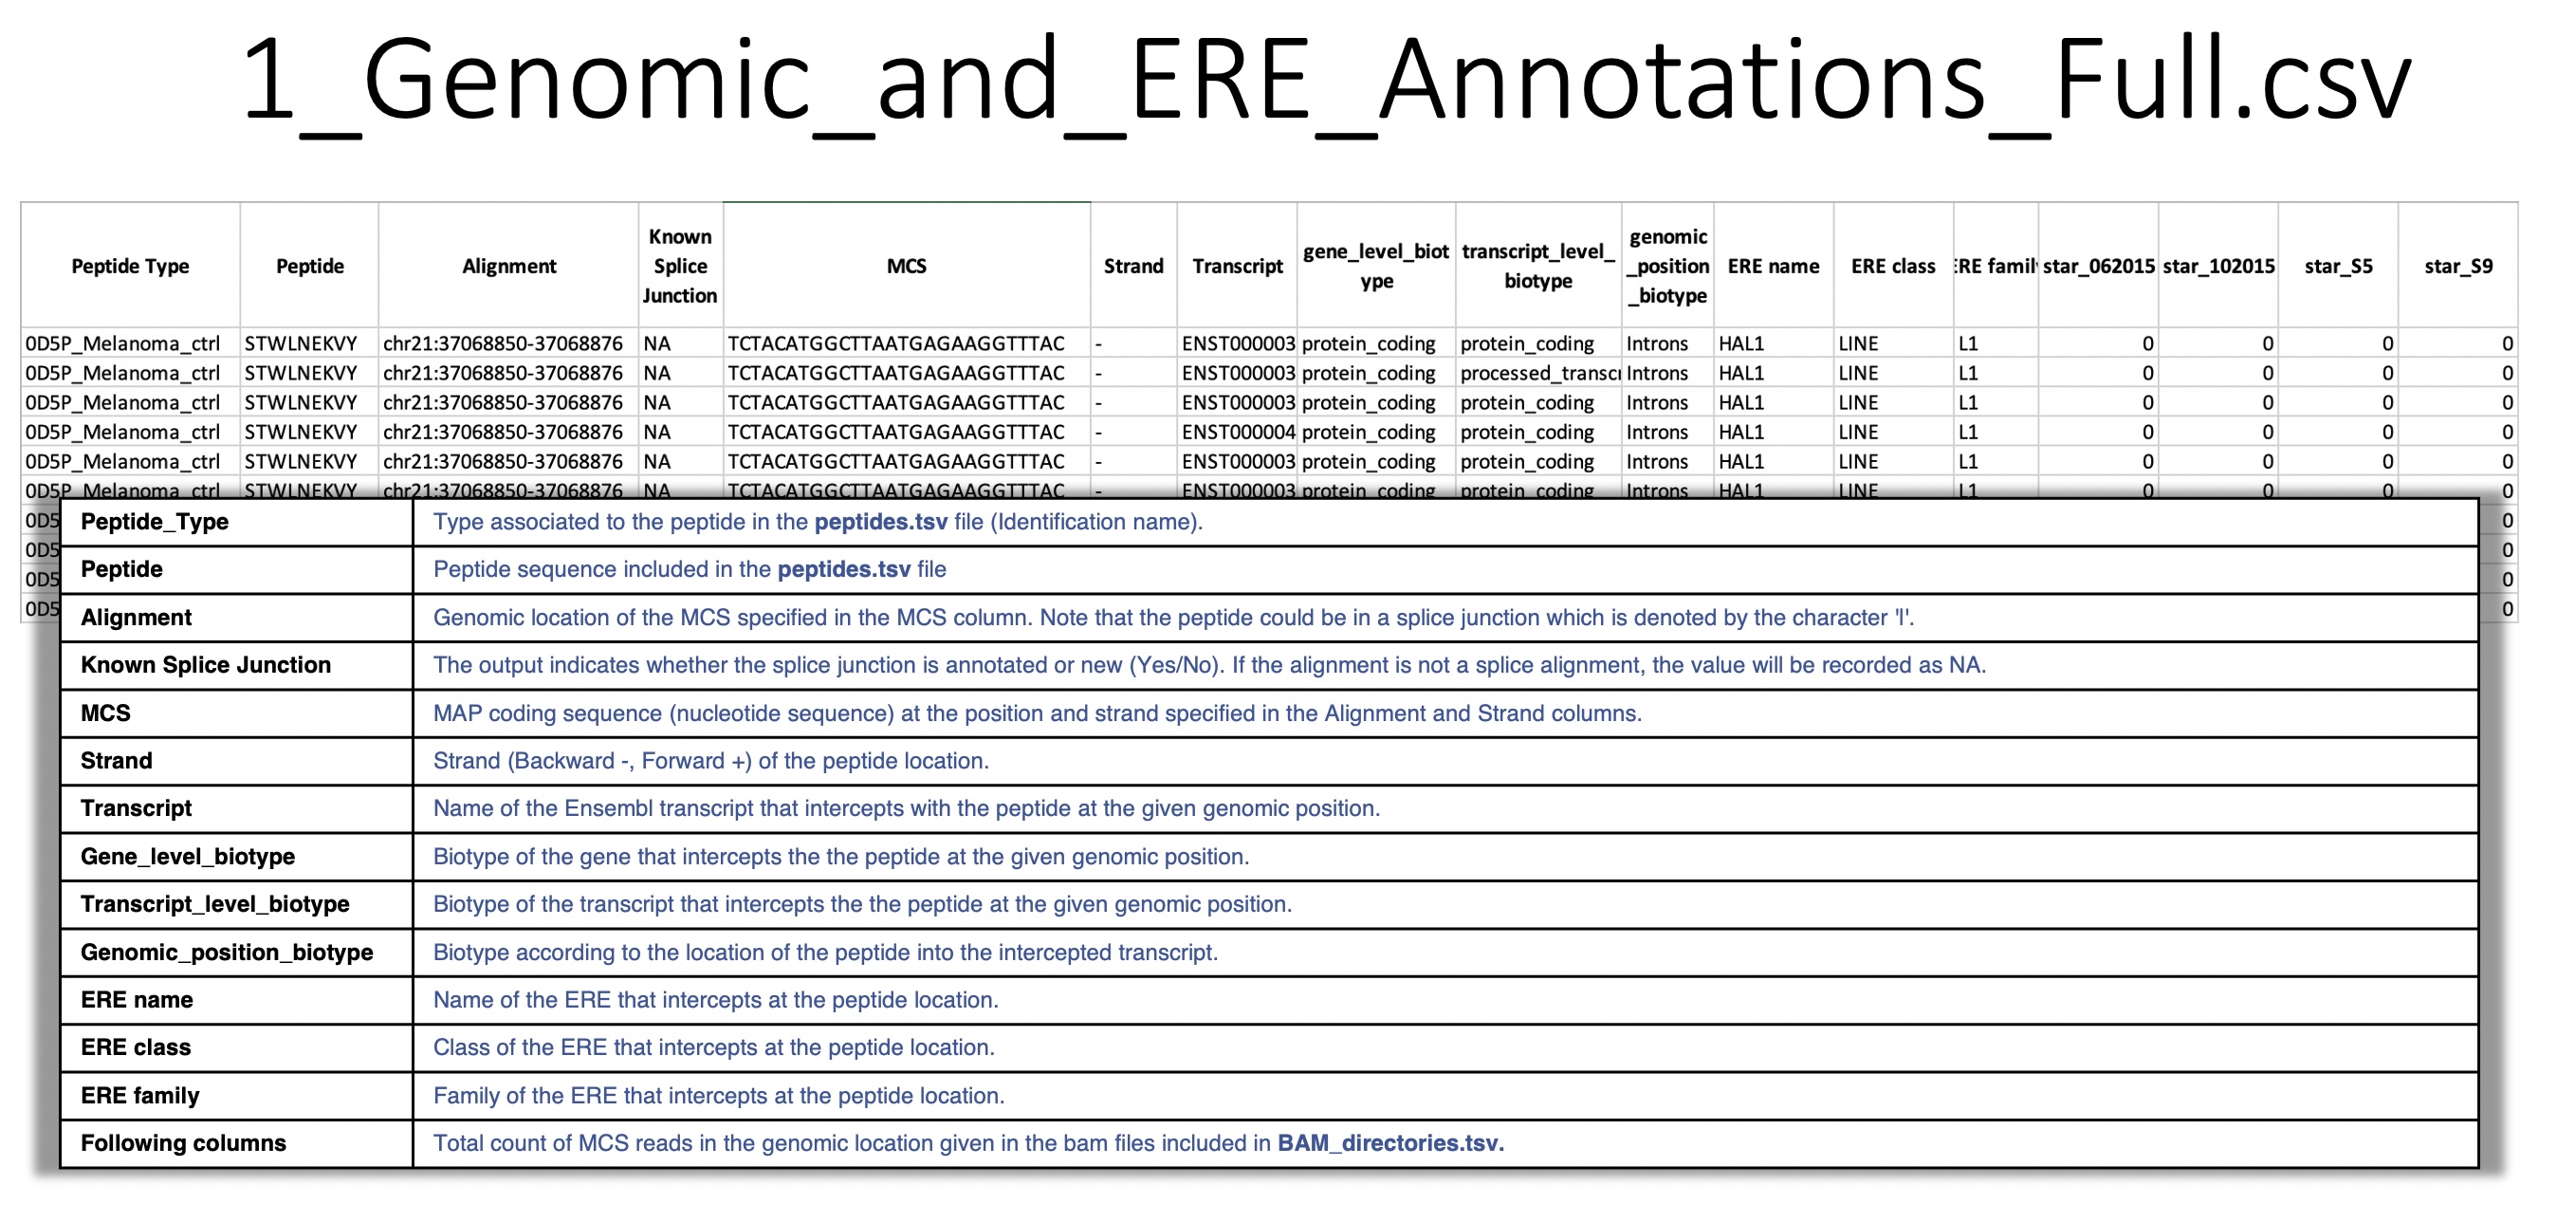
1_Genomic_and_ERE_Annotations_Full.csv: For a given peptide carrying an MCS mapped to a given genomic location, BamQuery reports all overlapping biotypes in the Ensembl and Repeat Masker annotations.
Overlap information:
gene
transcript
genomic location
ERE name
ERE class
ERE family
also, the total count of RNA-seq reads bearing the given MCS at the given location in each BAM/CRAM included in BAM_directories.tsv.
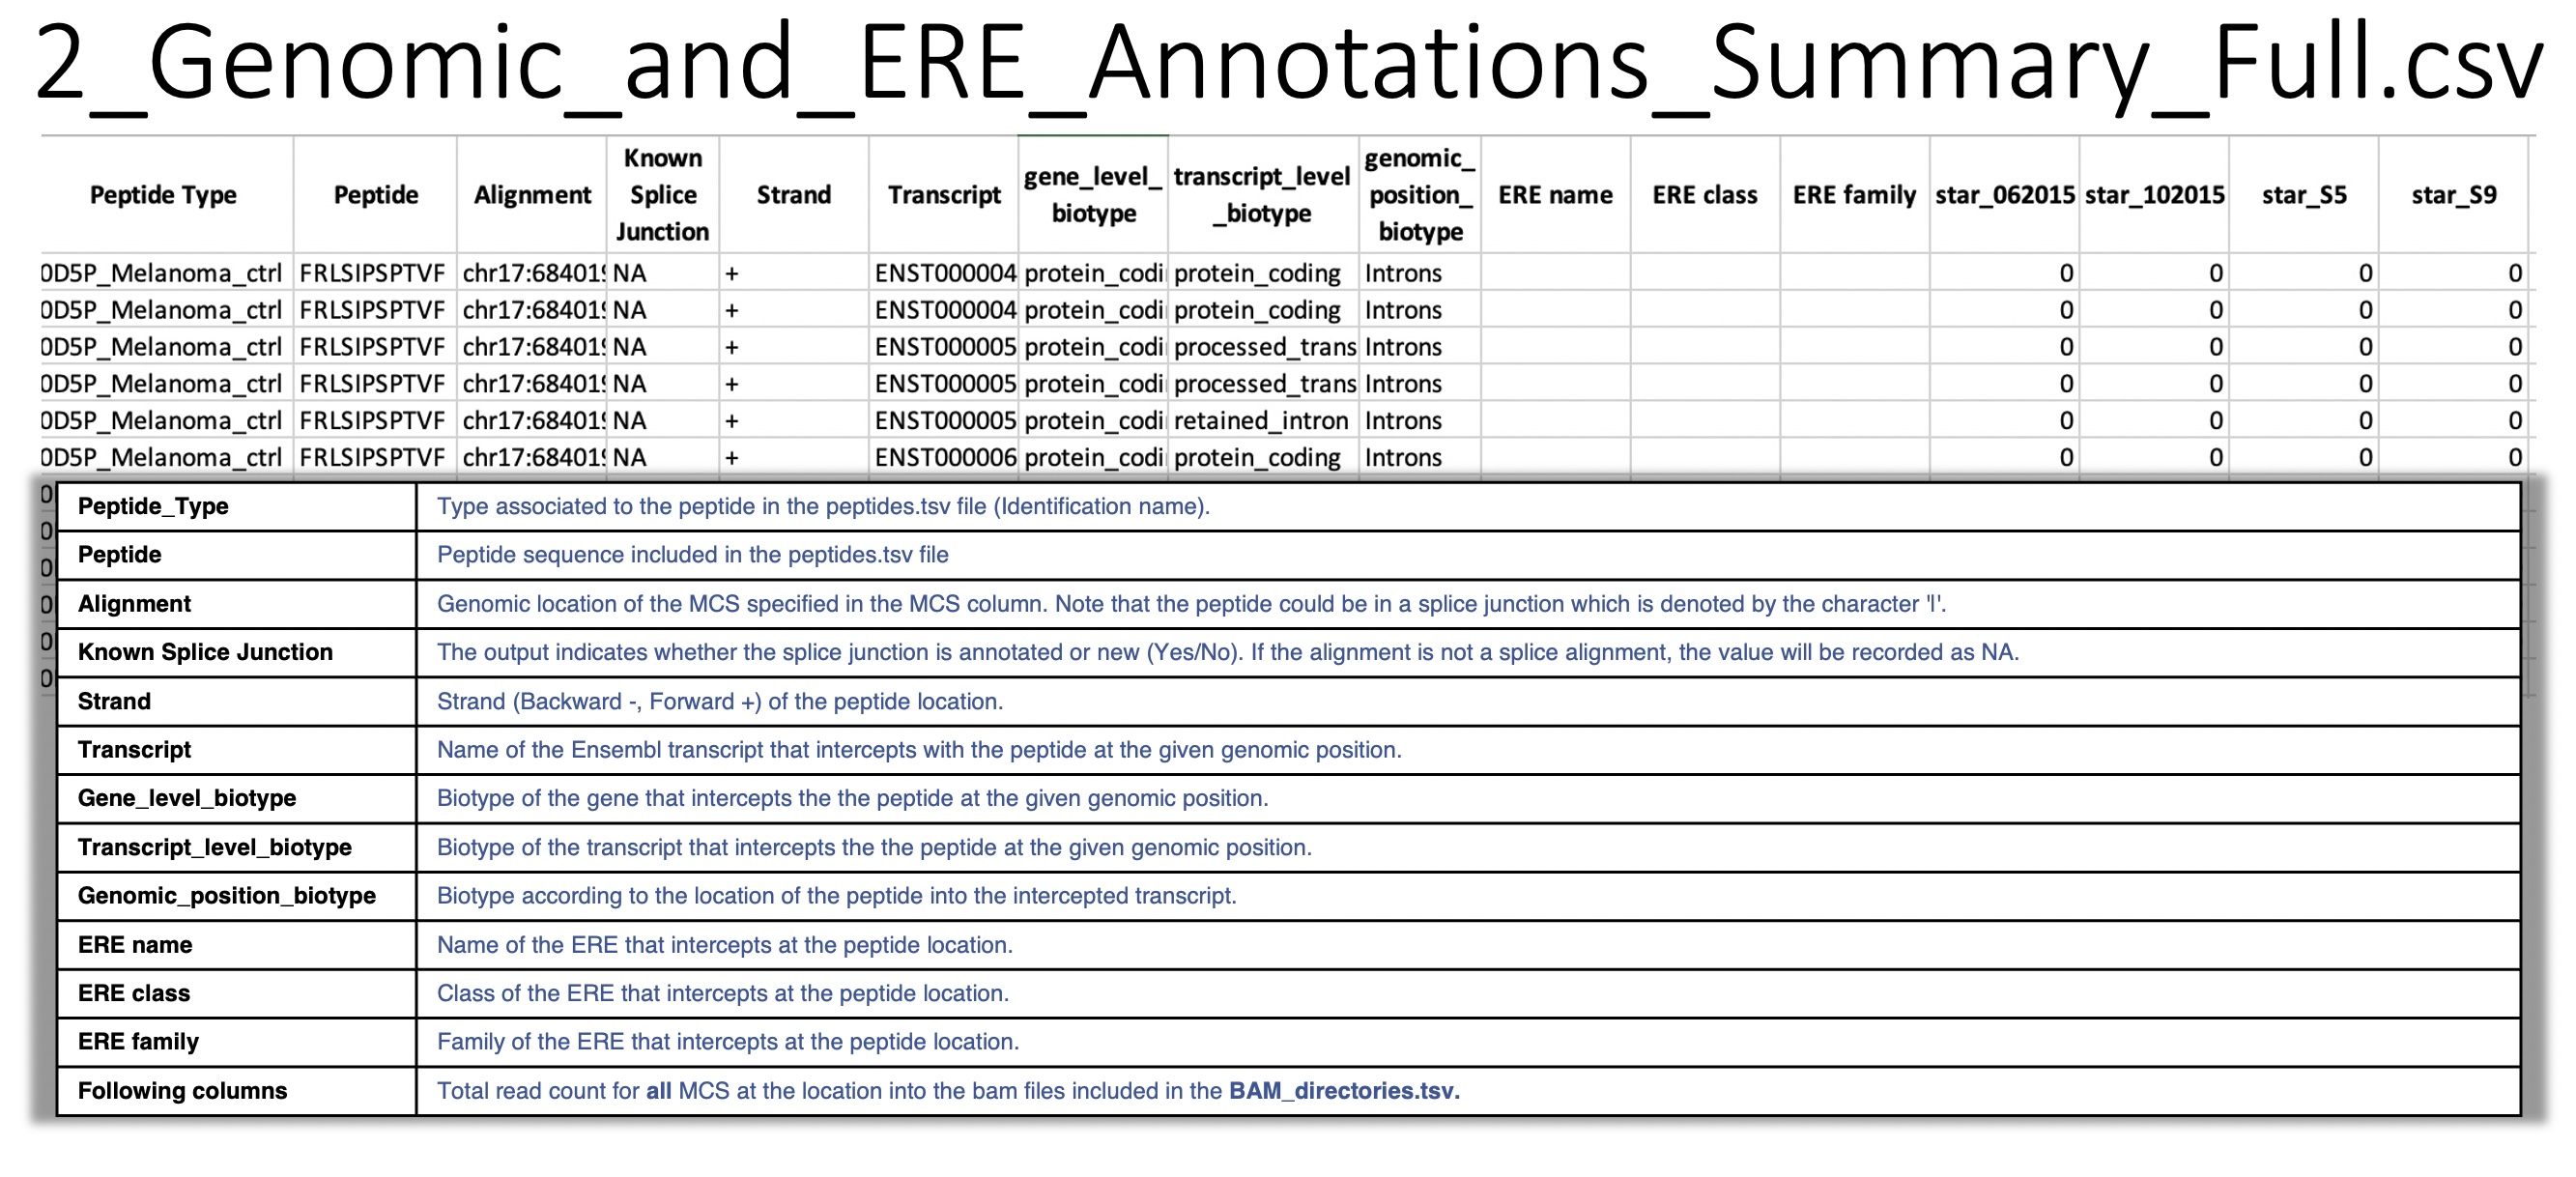
2_Genomic_and_ERE_Annotations_Summary_Full.csv: For a given peptide at a given genomic location, BamQuery reports all overlapping biotypes in the Ensembl and Repeat Masker annotations.
Overlap information:
gene
transcript
genomic location
ERE name
ERE class
ERE family
also, the total count of RNA-seq reads at the given location in each BAM/CRAM included in BAM_directories.tsv.
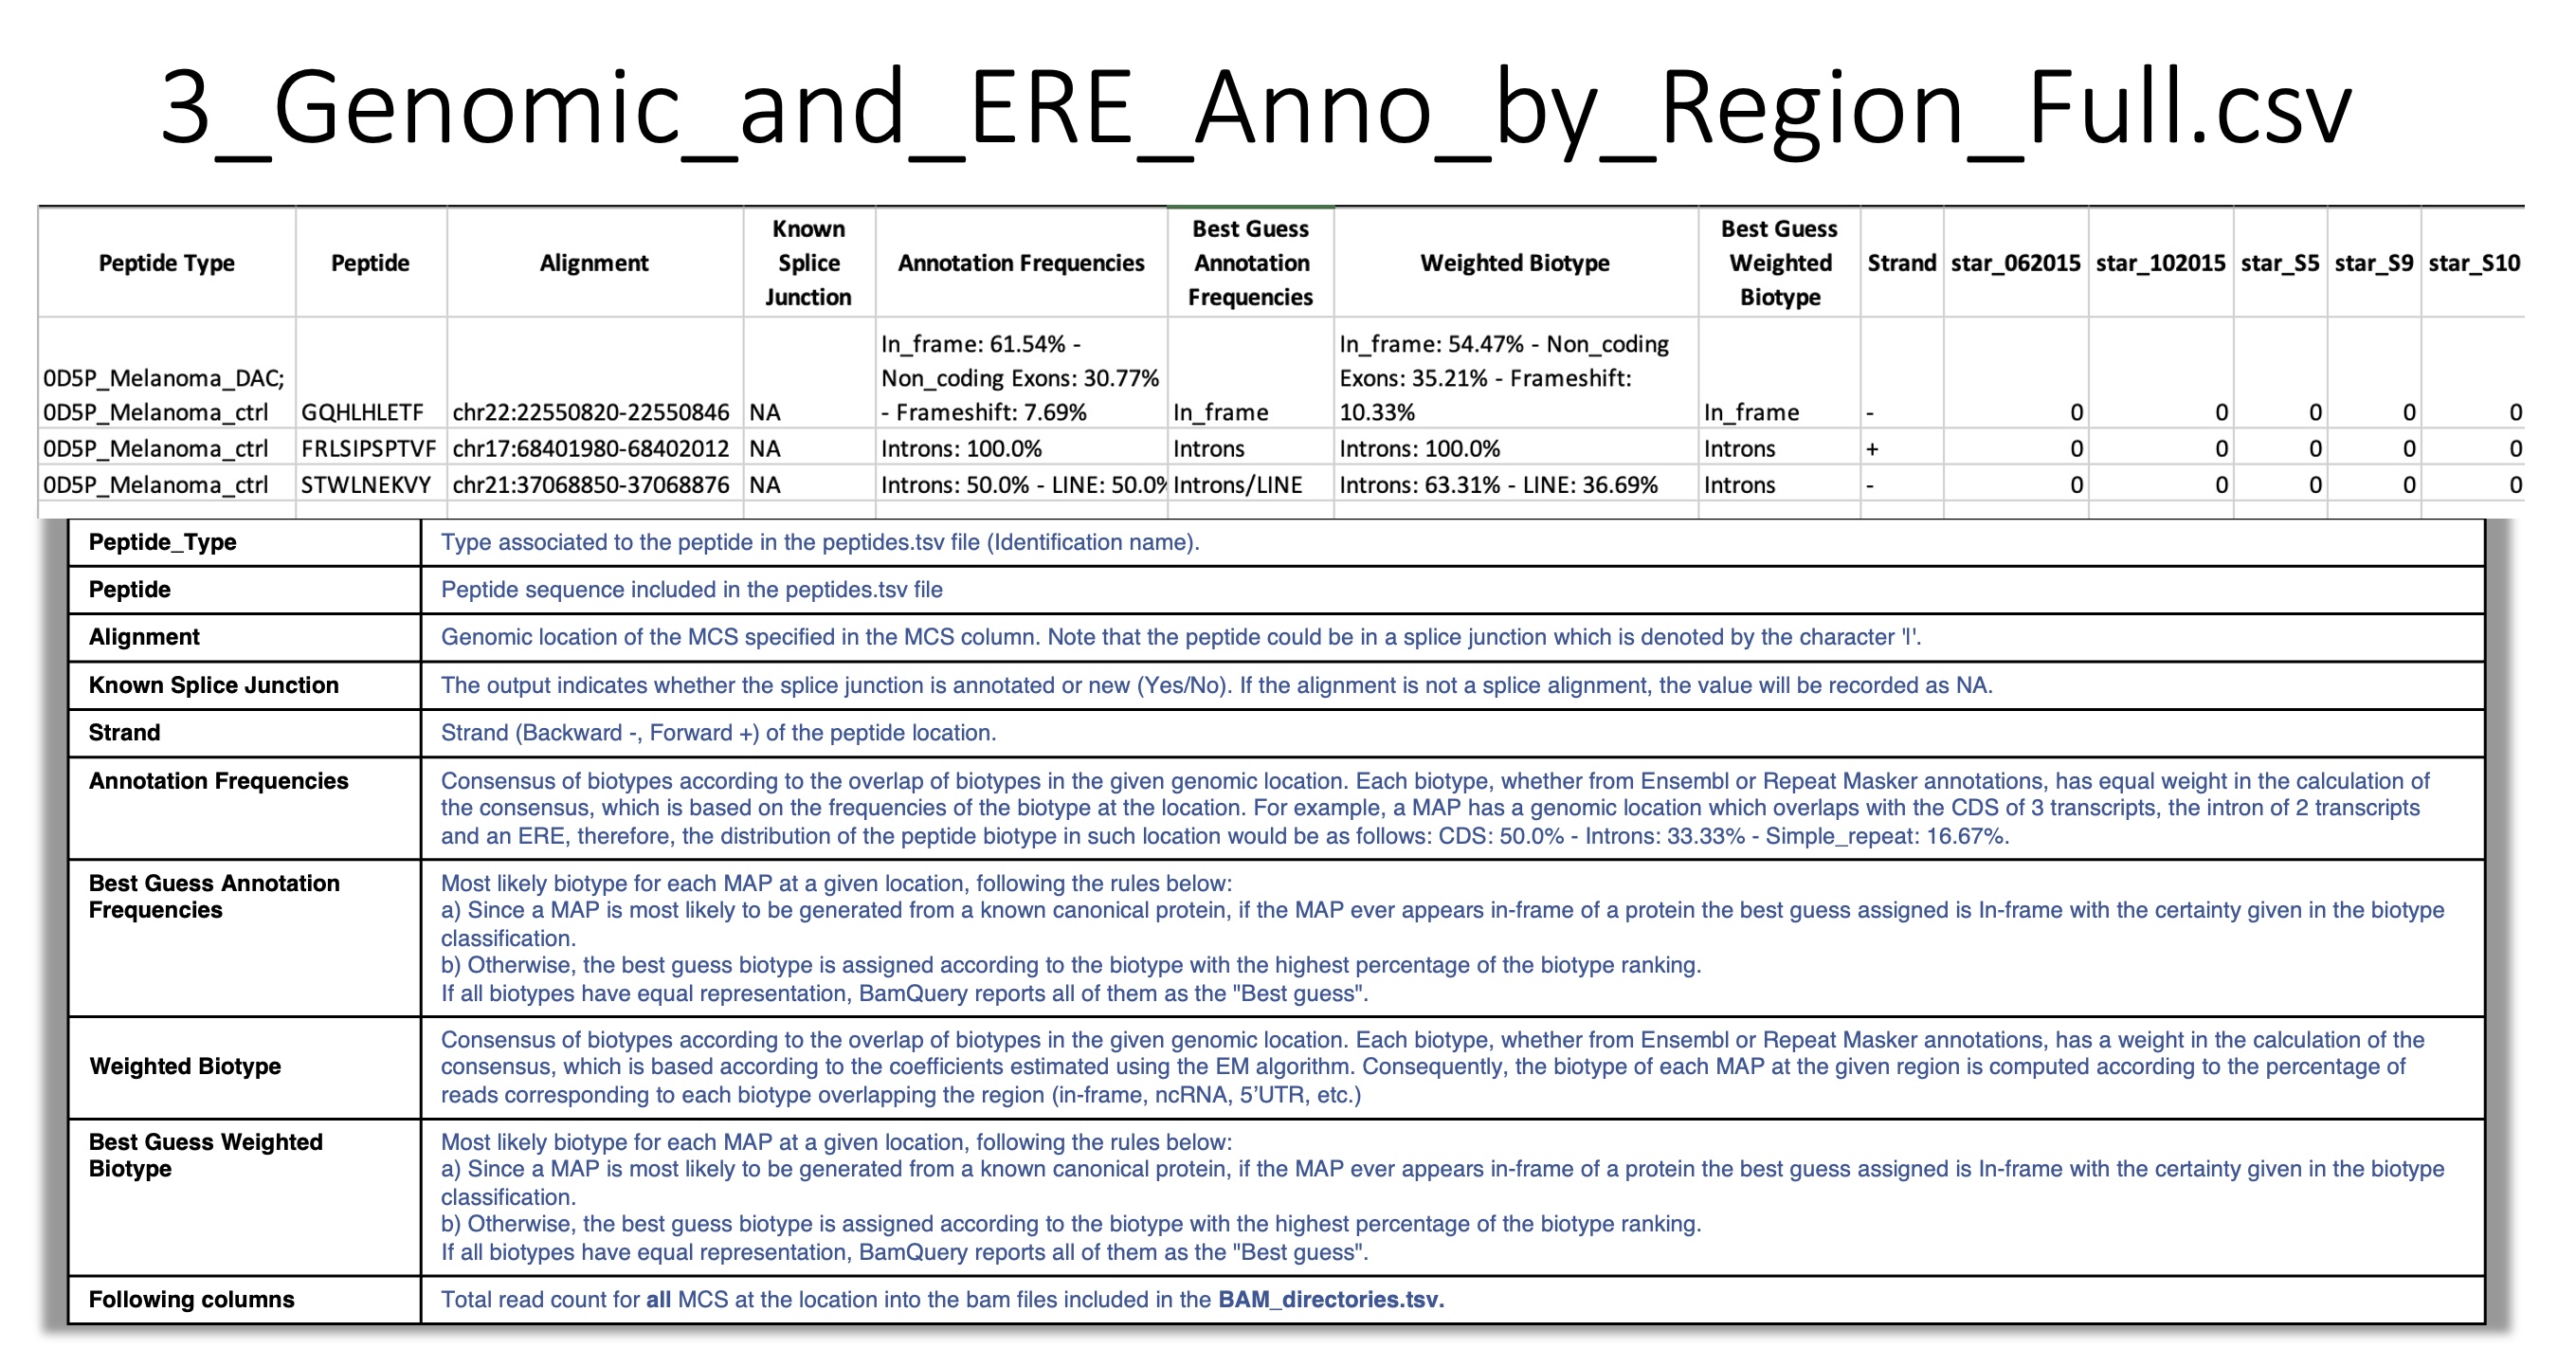
3_Genomic_and_ERE_Anno_by_Region_Full.csv:
For a given peptide at a given location, BamQuery reports a consensus biotype according to all overlapping biotypes at the genomic location (either from Ensembl or from Repeat Masker annotations).
First, BamQuery reports a consensus Annotation Frequencies in which each overlapping biotype has equal weight in the consensus calculation. This biotype is based on the frequencies of the biotype at the location.
Second, BamQuery reports a consensus Weighted Biotype in which each overlapping biotype is weighted according to the coefficients estimated with the EM algorithm.
These coefficients are used in the consensus calculation to determine the percentage contribution to each biotype.
For example:
- One location was collected for a given peptide.
In the same location the peptide overlaps in frame two transcripts of a canonical protein (
In_frame).In the same location the peptide overlaps the 3’UTR of one transcript of the same canonical protein (
3'UTR).In the same location the peptide overlaps an ERE region (
ERE).
The final biotype corresponding to the Annotation Frequencies for the peptide at the given location is given as:
In_frame : 50%, 3'UTR : 25%, ERE : 25%. i.e, RNA-seq reads are attributed to each biotype according to the annotation frequencies at the location.
The final biotype corresponding to the Weighted Biotype for the peptide at the given location is given as:
In_frame : 75%, Introns : 19%, 3'UTR : 6%. i.e, RNA-seq reads are attributed to each biotype according to the coefficients estimated using the EM algorithm.
- Best guess :
In_frame, if the biotye is among the genomic position biotypes.Otherwise, the biotype with the highest percentage representation in annotation frequencies. If BamQuery detects that all biotypes have equal representation, it will report all of them as the
Best guess.
summary_info_biotypes
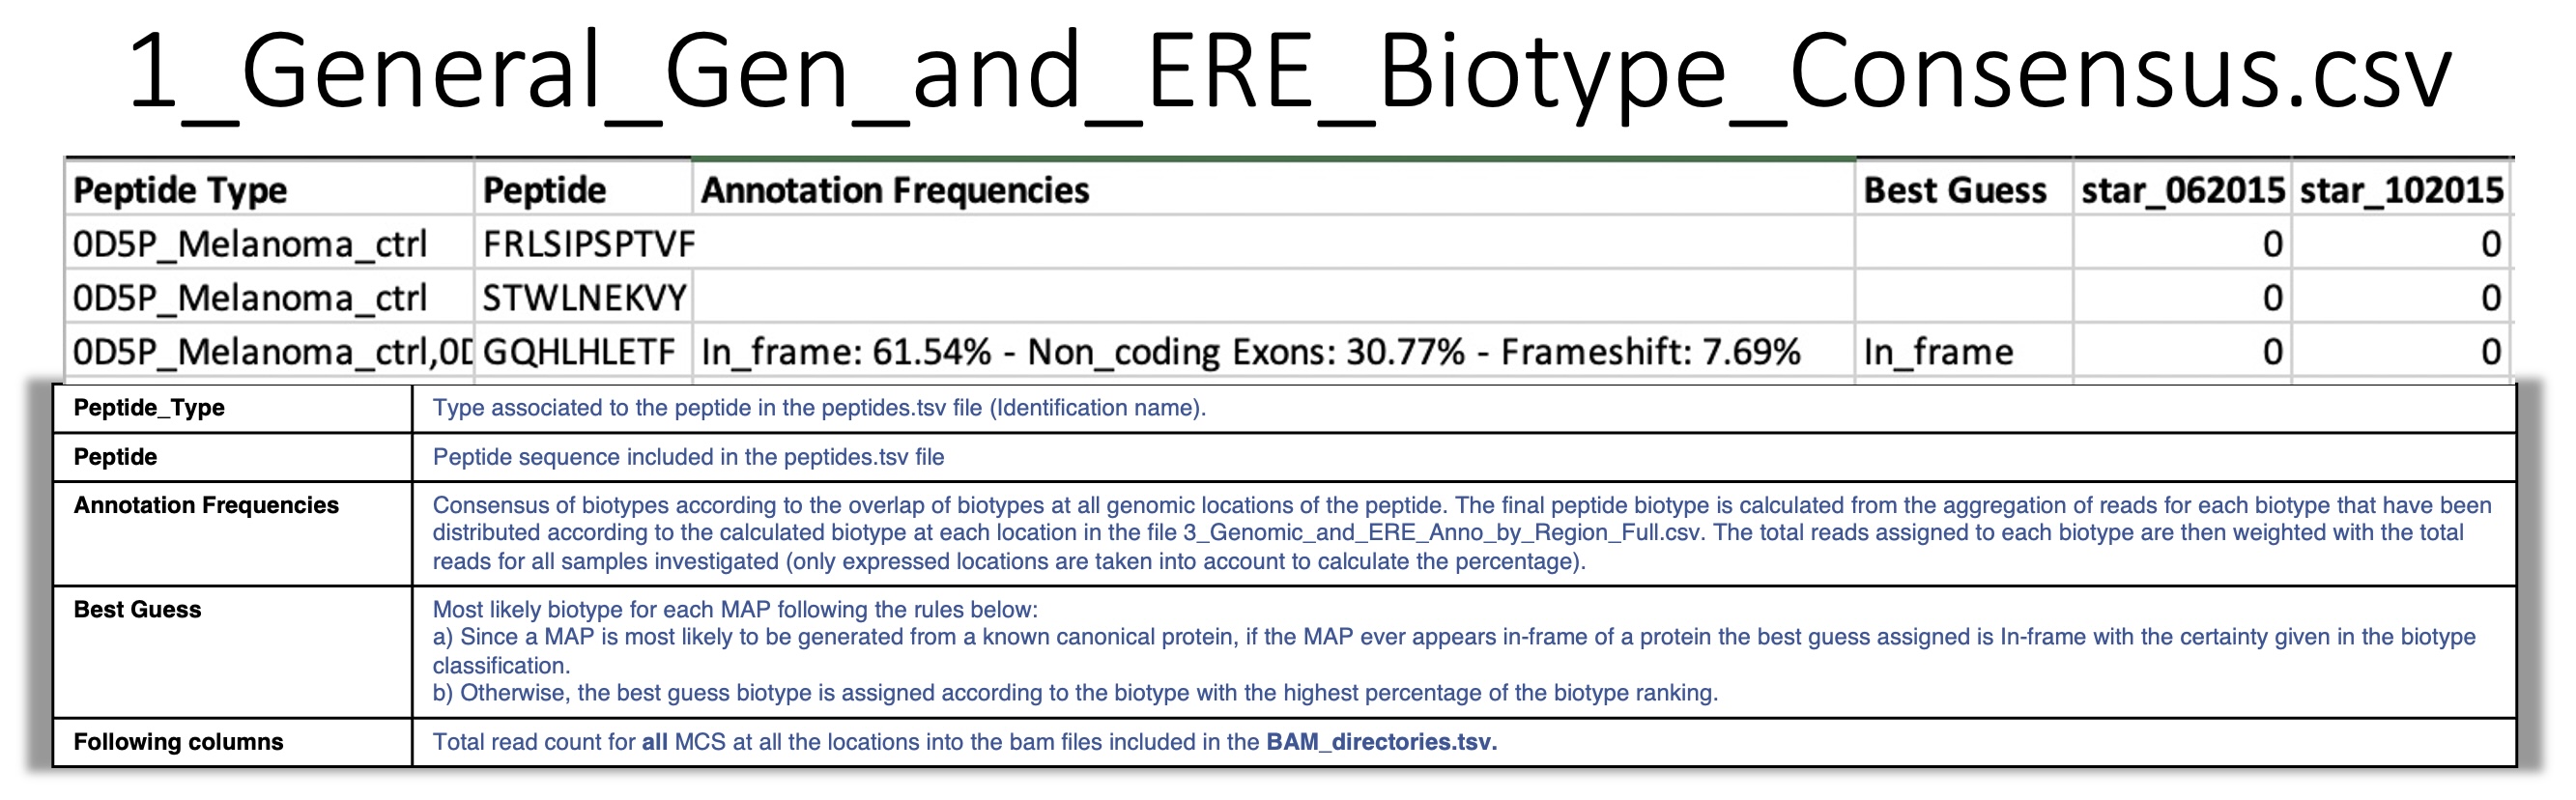
1_General_Gen_and_ERE_Biotype_Consensus.csv: For a given peptide, BamQuery reports assigns a consensus biotype taking into account all possible locations where the peptide appears in the genome. To assign the consensus biotype to the peptide, BamQuery aggregates all reads assigned to each biotype that were distributed according to the percentage of the biotype at each genomic location. This distribution is described in more detail in the file 3_Genomic_and_ERE_Anno_by_Region_Full.csv. Next, the total reads assigned to each biotype are weighted with the total reads of all samples investigated.
For example:
- Three locations were collected for a given peptide.
At location 1 the peptide overlaps in-frame with two transcripts of a canonical protein (
100% in_frame) and at that location there is a count of 10 RNA-seq reads.At location 2 the peptide overlaps in-frame with one transcript and in the 3’UTR of another transcript (
50% in_frame, 50% 3'UTR) and at that location there are 20 RNA-seq reads.At location 3 the peptide overlaps with the intronic region of a transcript (
100% Intron) and at that location there are 7 RNA-seq reads.
The final biotype for the peptide corresponds to:
In_frame : 54%, 3'UTR : 27%, Introns : 19%. i.e, RNA-seq reads are attributed to each biotype according to the annotation frequencies in all the peptidelocations.
- Best guess :
In_frame, if the biotype is among the genomic position biotypes.Otherwise, the biotype with the highest percentage representation in annotation frequencies. If BamQuery detects that all biotypes have equal representation, it will report all of them as the
Best guess.
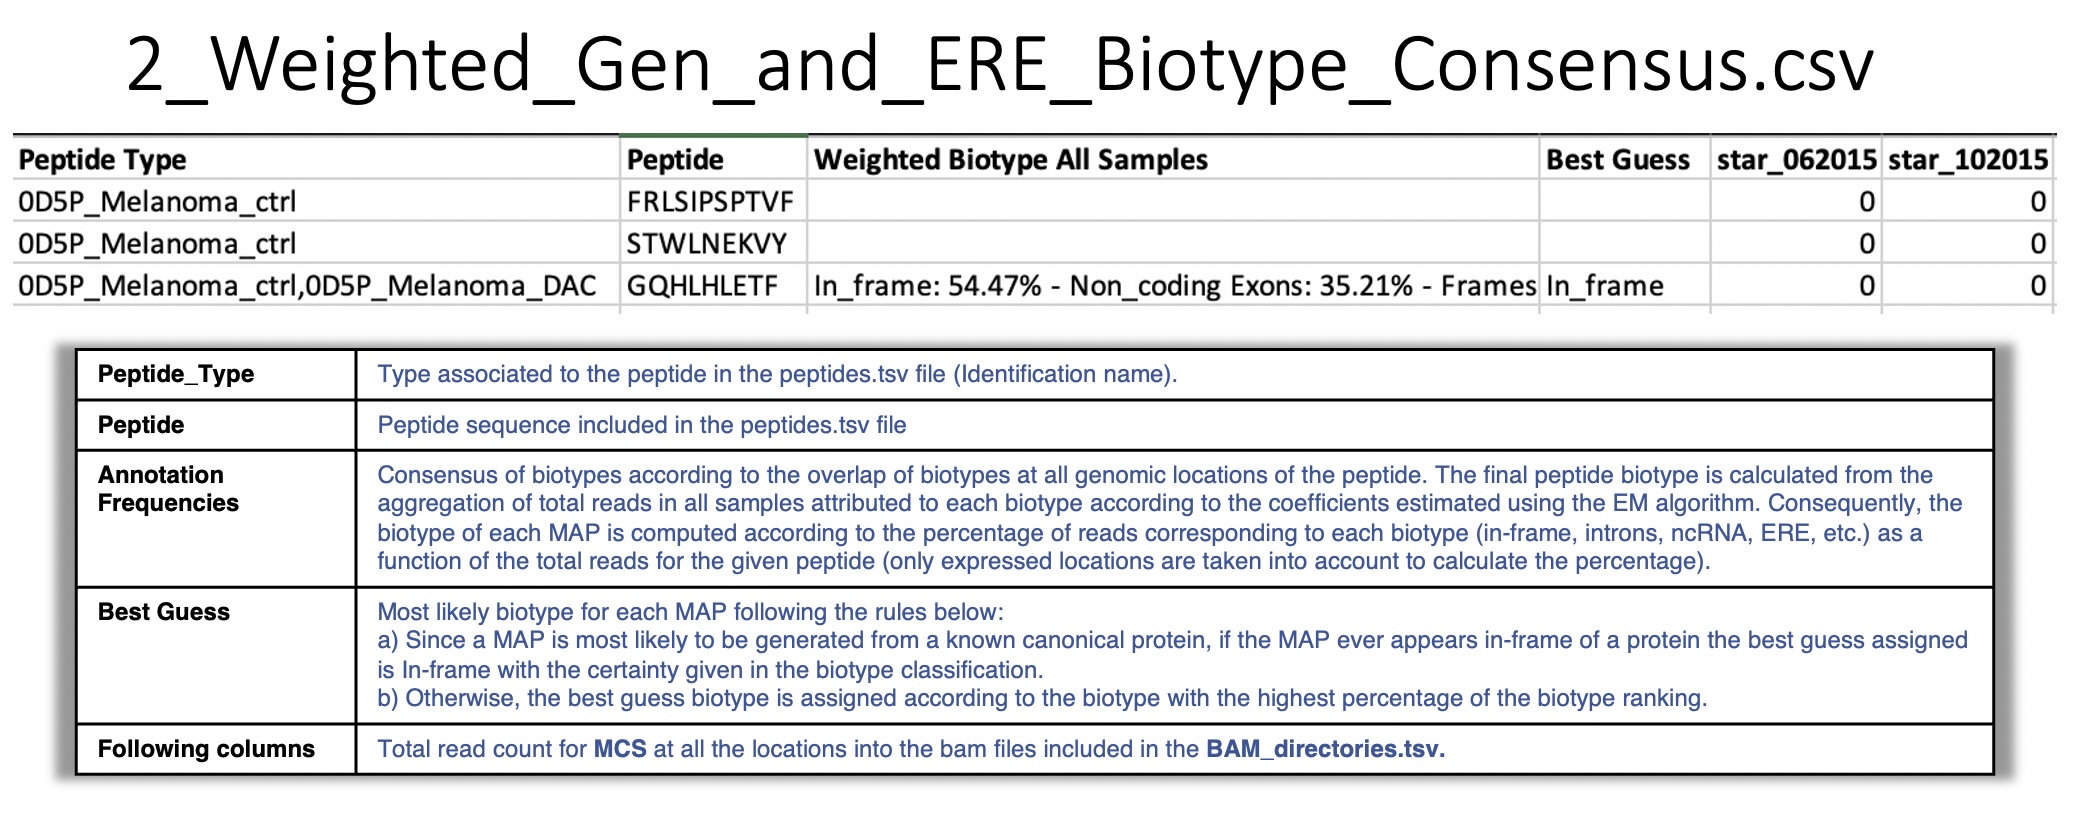
2_Weighted_Gen_and_ERE_Biotype_Consensus.csv:
For a given peptide, BamQuery reports the consensus of biotypes according to their overlap at all genomic locations of the peptide.
The biotype representation (percentage) is computed from the count of RNA-seq reads attributed to each biotype according to the coefficients estimated using the EM algorithm as a function of the total reads for the given peptide in all the samples, (only expressed locations are taken into account to calculate the percentage) .
For example:
- Three locations were collected for a given peptide.
At location 1 the peptide overlaps in-frame with two transcripts of a canonical protein (
100% in_frame) and at that location there is a count of 10 RNA-seq reads.At location 2 the peptide overlaps in-frame with one transcript and in the 3’UTR of another transcript (
89% in_frame, 11% 3'UTR) and at that location there are 20 RNA-seq reads.At location 3 the peptide overlaps with the intronic region of a transcript (
100% Intron) and at that location there are 7 RNA-seq reads.
The final biotype for the peptide corresponds to:
In_frame : 75%, Introns : 19%, 3'UTR : 6%. i.e, RNA-seq reads are attributed to each biotype according to the coefficients estimated using the EM algorithm.
- Best guess :
In_frame, if the biotype is among the genomic position biotypes.Otherwise, the biotype with the highest percentage representation in the weighted biotype. If BamQuery detects that all biotypes have equal representation, it will report all of them as the
Best guess.
3_Group_Samples_Gen_and_ERE_Biotype_Consensus.csv:
For a given peptide, BamQuery reports the consensus of biotypes according to their overlap at all genomic locations of the peptide.
The biotype representation (percentage) is computed from the count of RNA-seq reads attributed to each biotype according to the coefficients estimated using the EM algorithm as a function of the total reads for the given peptide in every group of samples as well as for all the samples, (only expressed locations are taken into account to calculate the percentage) .
- Best guess :
In_frame, if the biotye is among the genomic position biotypes.Otherwise, the biotype with the highest percentage representation in the weighted biotype. If BamQuery detects that all biotypes have equal representation, it will report all of them as the
Best guess.

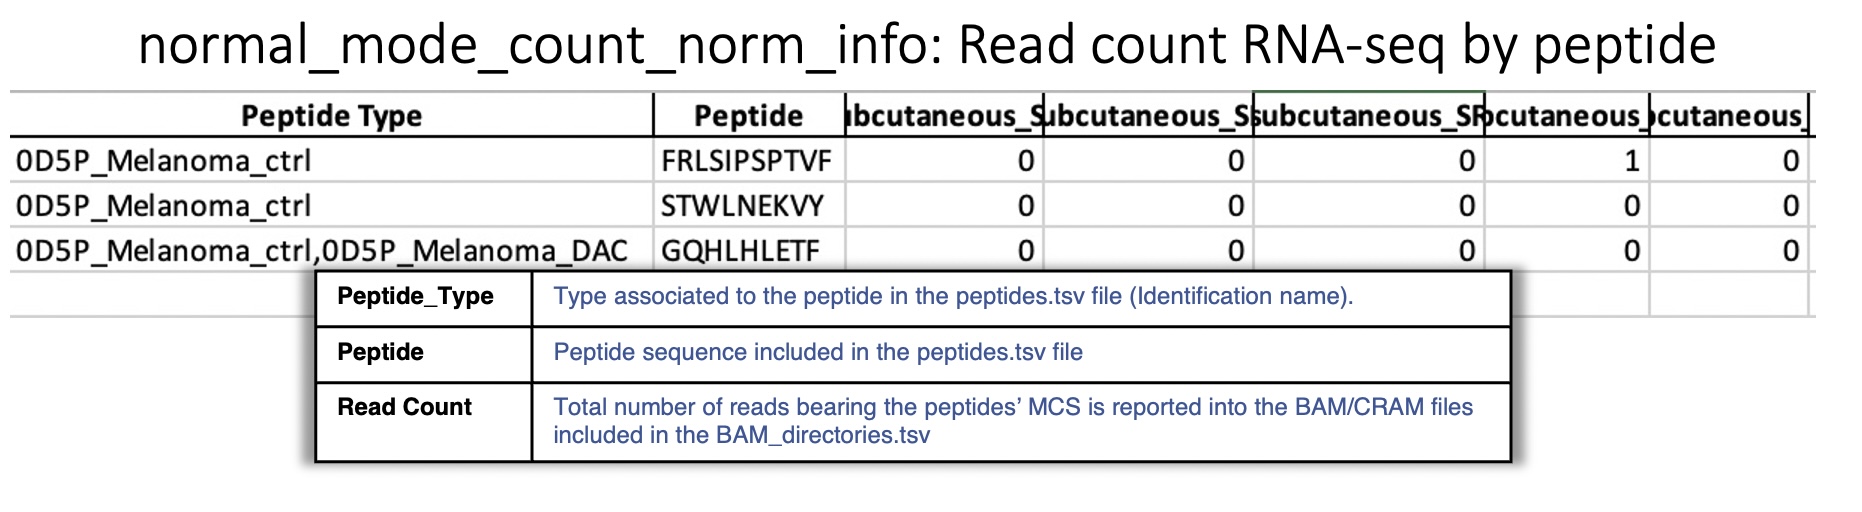
normal_mode_count_norm_info.xlsx
Sheet : Alignments Read count RNA-seq This sheet reports for each peptide queried, all positions in the genome that are perfect alignments for one or more coding sequences of a peptide are reported. For each position, the strand, coding sequence and read count for each BAM/CRAM file are reported.

Sheet : Read count RNA-seq by peptide This sheet reports for each peptide queried, the total reads for each BAM/CRAM file considering all positions.
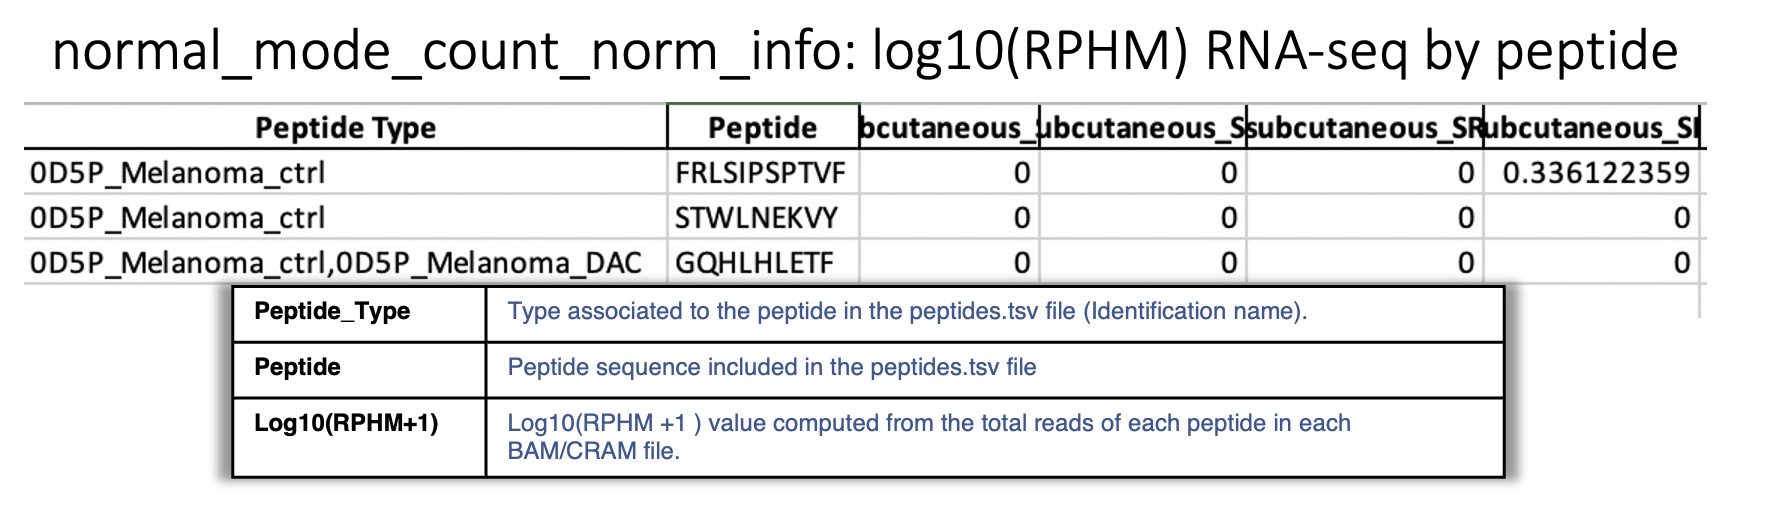
Sheet : log10(RPHM) RNA-seq by peptide
This sheet reports for each peptide queried, the \(rphm\) (read per hundred million) for each BAM/CRAM file considering all expressed positions. The \(rphm = (read\_overlap * 10^8)/total\_primary\_reads\) with total_primary_reads representing the total number of reads sequenced in a given RNA-Seq experiment. These values are transformed into logarithm \(log_{10}(rphm + 1)\).
This information is used to plot the rphm heat map. See heat maps folder
light mode example
The light mode of BamQuery was designed to perform a quick search for peptide expression in the specified BAM/CRAM files. In this mode, BamQuery only reports peptide counts and normalization, so no biotyping analysis is performed for peptides (heat map, pie chart are not produced).
Input
Command line:
BamQuery.py ./normal_mode_example/Input normal_mode_example v38_104 --light
As for normal mode, the input folder path_to_input_folder must containt the files : BAM_directories.tsv and peptides.tsv.
Output
BamQuery creates an output directory in the same path as the input folder.
This directory contains 3 folders and the main results are organized as follows:
├── alignments
│   ├── light_mode_info_alignments.xlsx
│   └── missed_peptides.info
├── logs
│  ├── BamQuery_Res_light_mode.log
│  └── Information_BAM_directories.log
└── res_light
    └── light_mode_count_norm_info.xlsx
The output files in light mode are similar to those in normal mode, see output_normal_mode_example for detailed information about the output files.
Note
After running BamQuery in –light mode, it is possible to run BamQuery in normal mode (to obtain biotype classification and other output files) for a subset of peptides (peptides of interest PoIs). To do this, first run BamQuery in light mode by adding the –dev parameter. Once BamQuery light has finished, modify the peptides.tsv file, to remove the peptides you are no longer interested in. Finally, run the BamQuery search in normal mode by removing the –light option from the command line. By doing this, BamQuery takes the information already obtained for the expression in light mode and produces heatmap plots and does the biotype analysis only for the PoIs.
Warning
WARNING: do not modify the BAM_directories.tsv, otherwise you will not have consistent information.
single cell example
BamQuery single cell was designed to perform searches in BAM files from single-cell RNA-seq data. Therefore, BamQuery only reports peptide counts for each cell in each single-cell BAM file, so no normalization (rphm values) and biotyping analysis is performed for peptides (no graph (heat map, pie chart) is produced).
Input
Command line:
BamQuery.py ./sc_example/Input sc_example v38_104 --sc
As for normal mode, the input folder path_to_input_folder must containt the files : BAM_directories.tsv and peptides.tsv.
Output
BamQuery creates an output directory in the same path as the input folder.
This directory contains 3 folders and the main results are organized as follows:
├── alignments
│   ├── missed_peptides.info
│   └── sc_example_info_alignments.xlsx
├── logs
│  ├── BamQuery_Res_sc_example.log
│  └── Information_BAM_directories.log
└── res
    ├── sc_example_cell_names_identification.csv
        ├── sc_example_index_bam_files.csv
        ├── sc_example_rna_sc_count_All_alignments.csv
    └── sc_example_rna_sc_count.csv
The output files with BamQuery single cell are similar to those in normal mode, see output_normal_mode_example for detailed information about the output files : missed_peptides.info, sc_example_info_alignments.xlsx and logs.
res
res
    ├── sc_example_cell_names_identification.csv
    ├── sc_example_index_bam_files.csv
    ├── sc_example_rna_sc_count_All_alignments.csv
    └── sc_example_rna_sc_count.csv
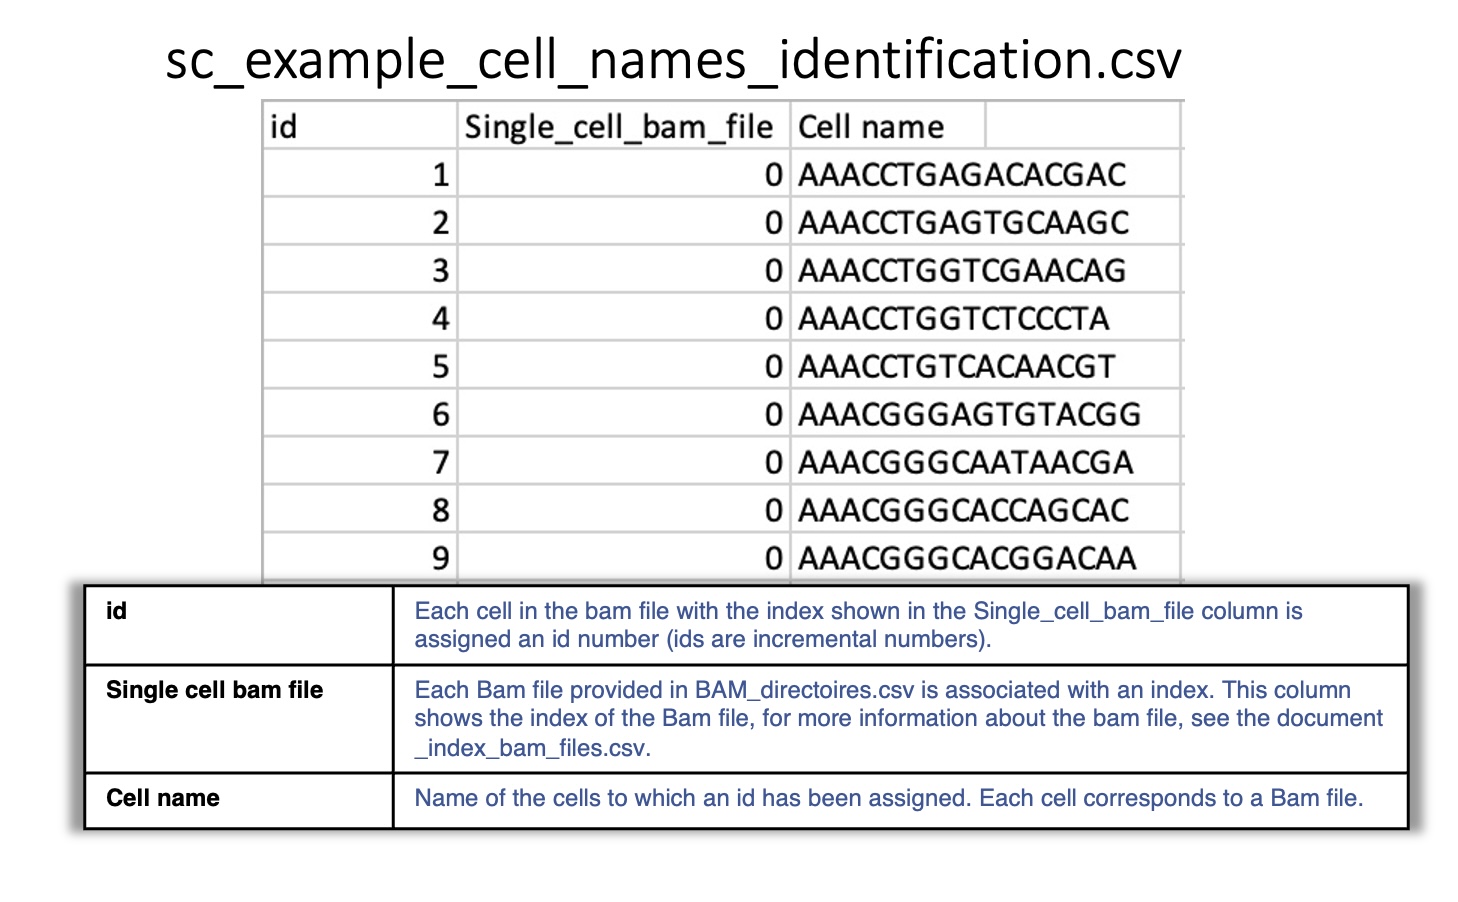
sc_example_cell_names_identification.csv:
Reports the cells in each single-cell BAM file included in BAM_directories.tsv.
Each BAM file is associated with an index, and each cell is associated with an id.
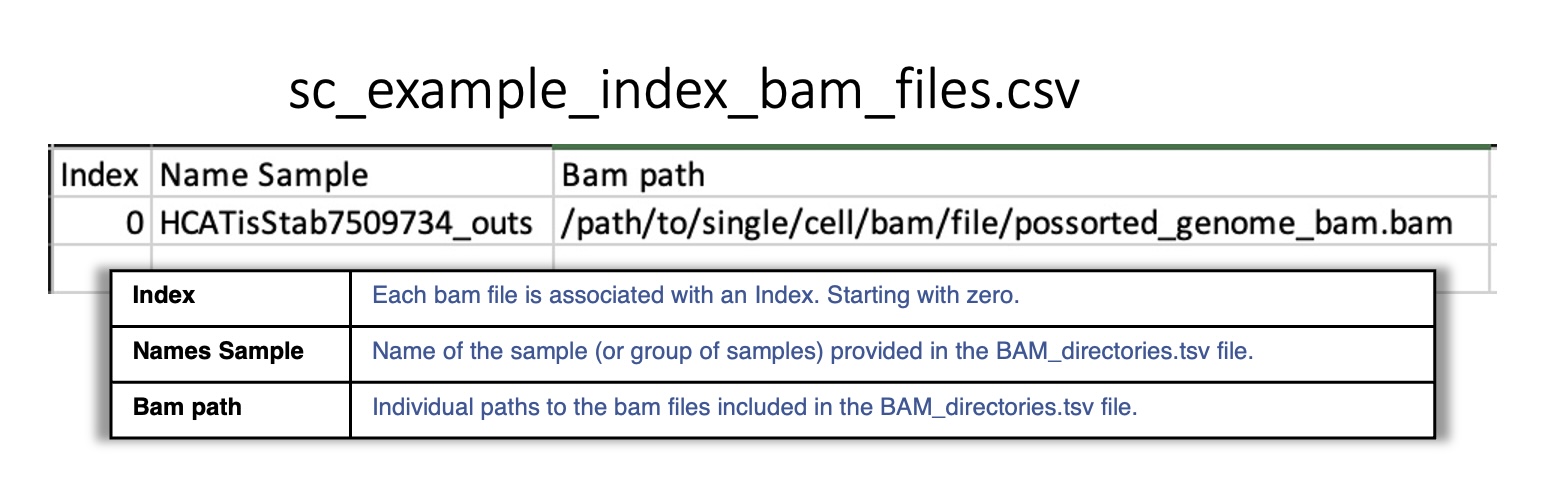
sc_example_index_bam_files.csv:
Reports the index associated to each single-cell BAM file included in BAM_directories.tsv.
sc_example_rna_sc_count_All_alignments.csv:
Reports for each MCS at a given location the total of RNA-seq reads in each cell found in single-cell BAM file included in BAM_directories.tsv.
Each cell is identified by its assigned id.
For instance: 1 corresponds to the cell AAACCTGAGACACGAC which is included in the first (0) BAM file in BAM_directories.tsv HCATisStab7509734_outs.

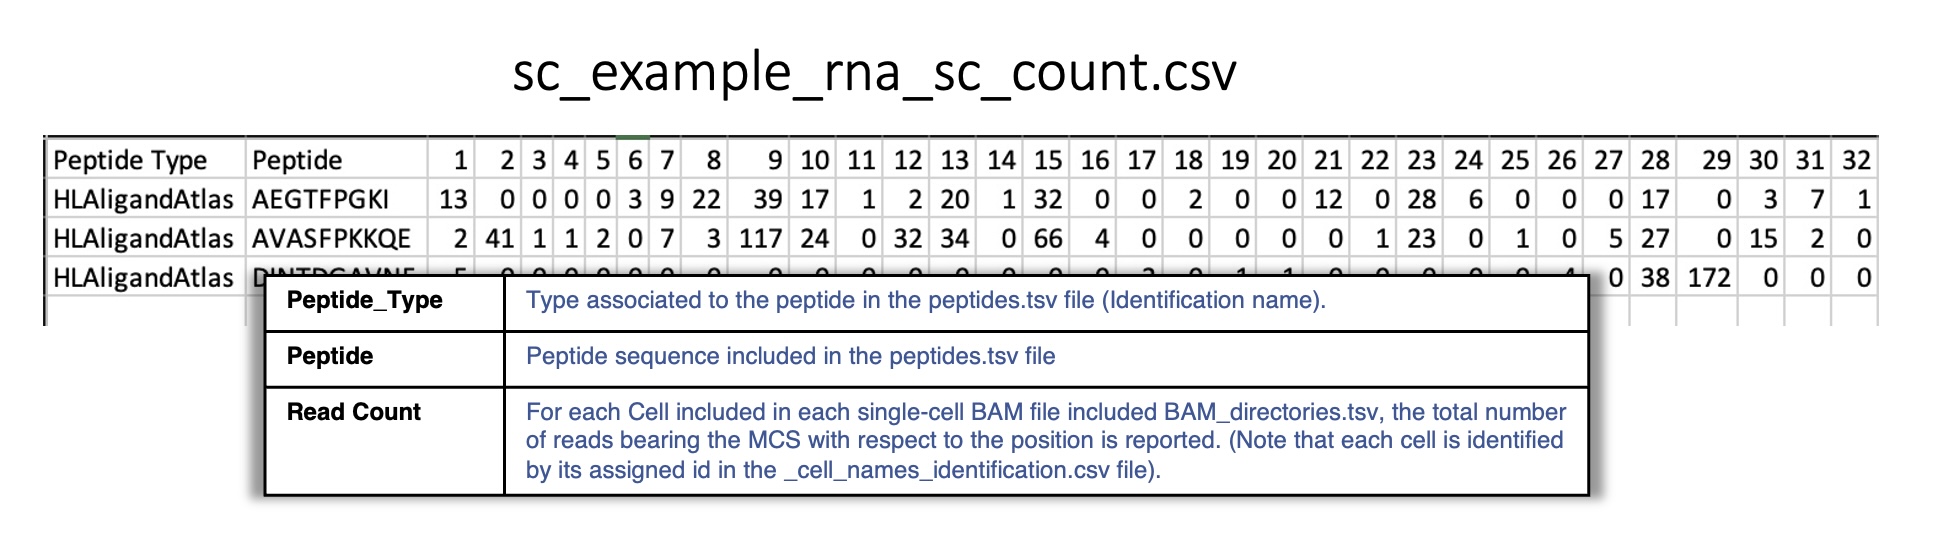
sc_example_rna_sc_count.csv:
Reports for each peptide the total of RNA-seq reads in each cell found in single-cell BAM file included in BAM_directories.tsv.
Each cell is identified by its assigned id.
For instance: 1 corresponds to the cell AAACCTGAGACACGAC which is included in the first (0) BAM file in BAM_directories.tsv HCATisStab7509734_outs.
Note
Use BamQuery to collect the unique molecular identifier (UMI) count for each peptide by using the following command:
BamQuery.py ./sc_example/Input sc_example v38_104 --sc --umi
translation mode example
The BamQuery translation mode was designed to search BAM files from Ribo-seq data. In this mode, BamQuery can be used as a means to verify the presence of ribosome profiling reads that overlap with peptide MCSs.
Aware that the length of Ribo-seq reads varies between ~24-32 nucletotides, BamQuery counts reads according to their percentage overlapping with the MCS. For example, if a Ribo-seq read overlaps with 70% of the MCS in a given region, BamQuery counts this read as 0.7 instead of 1.
Note
BamQuery counts all reads for which the overlap with the MCSs is equal or higher to 60%.
Input
In this mode, instead of BAM_directories.tsv BamQuery expects a BAM_ribo_directories.tsv that includes the Ribo-seq datasets.
Command line:
BamQuery.py ./translation_example/Input translation_example v38_104 --mode translation
Input folder path_to_input_folder must containt the files : BAM_ribo_directories.tsv and peptides.tsv.
Output
BamQuery creates an output directory in the same path as the input folder.
This directory contains 3 folders and the main results are organized as follows:
├── alignments
│   ├── missed_peptides.info
│   └── translation_example_info_alignments.xlsx
├── logs
│   ├── BamQuery_Res_translation_example.log
│   └── Information_BAM_directories.log
├── plots
│   └── heat_maps
│       └── translation_evidence_heatmap
│           ├── average_translation_expression_heatmap
│           │   ├── norm_info.csv
│           │   ├── translation_example_ribo_norm_all_tissues.pdf
│           │   └── translation_example_ribo_norm_selected_tissues.pdf
│           └── total_translation_expression_heatmap
│               ├── translation_example_ribo_counts.csv
│               ├── translation_example_ribo_counts.pdf
│               ├── translation_example_ribo_norm.csv
│               └── translation_example_ribo_norm.pdf
└── res_translation
    └── translation_example_ribo_count_info.xlsx
The output files (alignments and logs) in BamQuery translation mode are similar to those in normal mode, see output_normal_mode_example for detailed information about the output files : missed_peptides.info, sc_example_info_alignments.xlsx and logs.
plots
plots
└── heat_maps
        └── translation_evidence_heatmap
                ├── average_translation_expression_heatmap
                │   ├── norm_info.csv
                │   ├── translation_example_ribo_norm_all_tissues.pdf
                │   └── translation_example_ribo_norm_selected_tissues.pdf
                └── total_translation_expression_heatmap
                                                ├── translation_example_ribo_counts.csv
                                                ├── translation_example_ribo_counts.pdf
                                                ├── translation_example_ribo_norm.csv
                                                └── translation_example_ribo_norm.pdf
heat_maps
This folder contains the heat maps representing the translation expression level of all peptides queried.
average_translation_expression_heatmap folder:
Heat maps representing the mean translation expression for each peptide queried in the tissues associated with the BAM/CRAM ribo-seq files.
norm_info.csv: reports, for each peptide queried, the mean and median values of rphm in the tissues associated with the BAM/CRAM ribo-seq files.
_norm_all_tissues.pdf : Heat map representing the mean level of translation expression associated with tissue types, computed from all samples in the tissue.
_norm_selected_tissues.pdf: Heat map representing the mean level of translation expression associated with tissue types, computed from selected tissues (short list of tissues).
total_translation_expression_heatmap folder:
Heat maps representing the mean translation expression and total number of ribo-seq reads for each peptide queried in each BAM/CRAM ribo-seq file.
_ribo_counts.csv: reports, for each peptide queried, the total number of ribo-seq reads in each BAM/CRAM ribo-seq file.
_ribo_counts.pdf: heat map representing the mean number of ribo-seq reads in each BAM/CRAM ribo-seq file.
_ribo_norm.csv: reports, for each peptide queried, the mean rphm values in each BAM/CRAM ribo-seq file.
_ribo_norm.pdf: heat map representing the mean translation expression level of each peptide in each BAM/CRAM ribo-seq file.
Warning
Heat maps are produced for searches with less than 400 peptides.
Heat map in total_translation_expression_heatmap is produced only if the number of BAM/CRAM files queried are less than 100 tissues.